Search & See How Your School Performed
2024 NJ Student Learning Assessment Scores
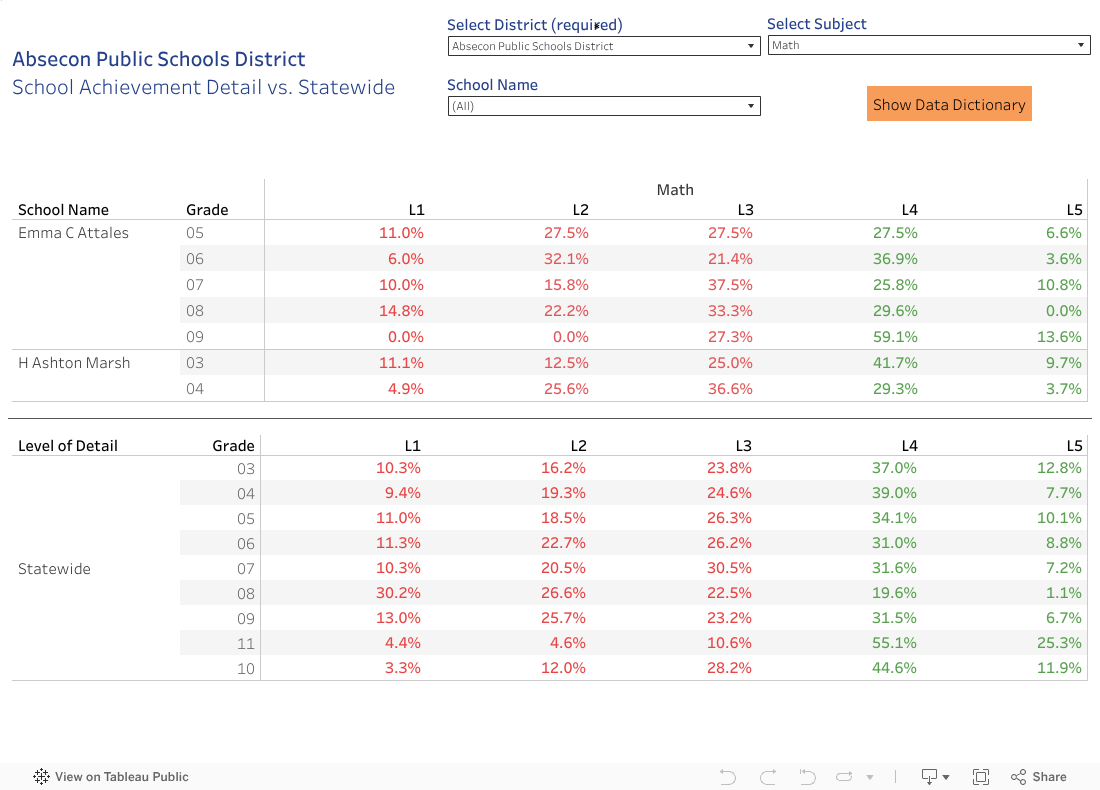
Search New Jersey’s public school results from state-administered testing. Results show what percentage of each grade level scored below, near, at, or above proficiency for that grade level’s standards. L1, L2, and L3 are all below proficiency.*
For additional information about your local school, including trend data, absenteeism, and graduation rates, please visit https://rc.doe.state.nj.us/.
Scoring levels:
L1 = Did Not Meet Expectations
L2 = Partially Met Expectations
L3 = Approached Expectations
L4 = Met Expectations
L5 = Exceeded Expectations
According to this scoring guide, only scores at L4 or L5 count as performing “at or above grade level.”
Example:
When looking at third grade math results, 34.6% of students “met expectations” and 13.0% of students “exceeded expectations.”
This means only 47.6% of third grade students in NJ’s public schools performed at or above grade level.
*Science is scored on a L1, L2, L3, and L4 scale. L3 and L4 are at or above proficiency.